最近在弄多服务器时间的巡检和校对,选择了 Prometheus + Pushgateway 的方式来收集和输出结果,做个备忘.
部署 Prometheus 去 Prometheus 官网 下载好对应系统的版本后,解压到你想放的地方运行即可,这里我使用了 supervisor 进行自启动和运行控制 Prometheus / Pushgateway.
1
2
3
4
5
6
7
wget https://github.com/prometheus/prometheus/releases/download/v2.18.1/prometheus-2.18.1.linux-amd64.tar.gz tar -xzvf /PATH/TO/STORAGE -C cd /PATH/TO/STORAGE./prometheus
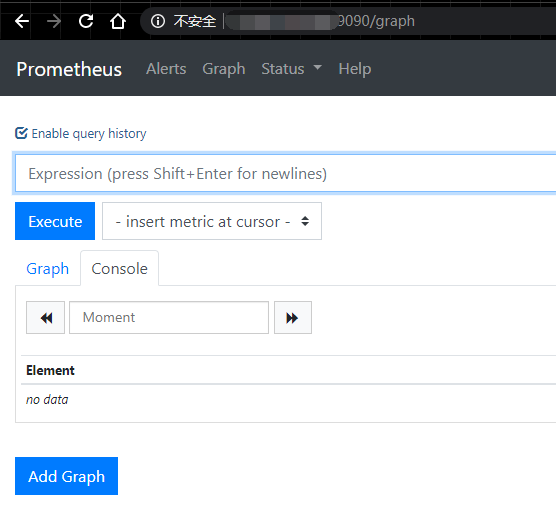
这样 Prometheus 就运行在 http://localhost:9090 上了.
如果你不想用默认的端口,可以修改同目录下的 prometheus.yml 中 scrape_configs 区域的选项,将 job_name 为 prometheus 的 static_configs -> targets 中的地址和端口修改成你想要的结果.
部署 Pushgateway 去 Github - Pushgateway 下载对应系统的版本后,解压到想放的地方.
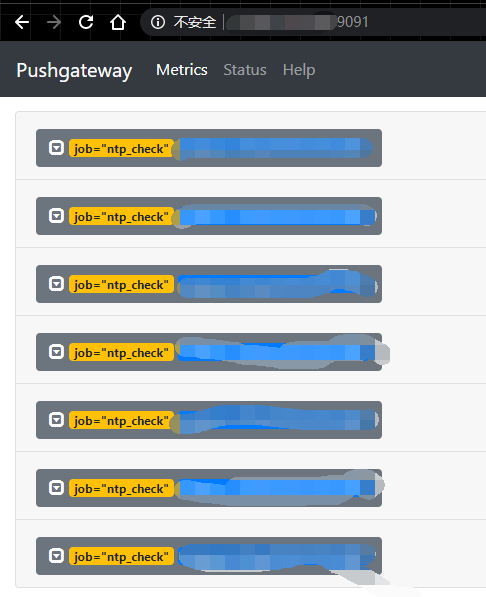
然后运行即可,默认的地址是 http://localhost:9091 .
1
2
3
4
5
6
7
wget https://github.com/prometheus/pushgateway/releases/download/v1.2.0/pushgateway-1.2.0.linux-amd64.tar.gz tar -xzvf /PATH/TO/STORAGE -C cd /PATH/TO/STORAGE./pushgateway
如果你想修改端口,在运行时指定参数 --web.listen-address=":port" 即可
通过 Pushgateway 向 Prometheus 推送数据 准备 在推送数据前,需要先把 Pushgateway 的配置公告给 Prometheus.
编辑 prometheus.yml ,在 scrape_configs 处(prometheus节点下)增加以下文本:
1 2 3 4 5 - job_name: 'prometheus-pushgateway' static_configs: - targets: ['localhost:9091' ]
修改完成后重启 Prometheus .
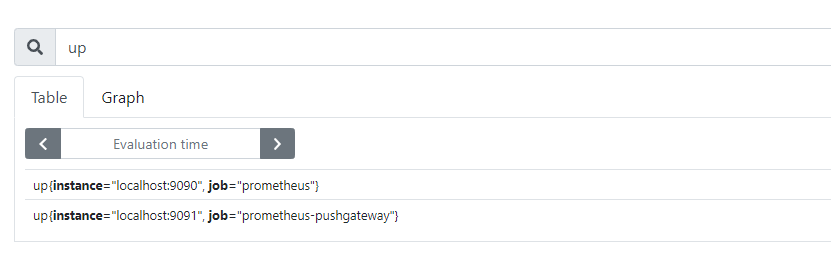
重启完毕后,在 Prometheus中查询 up,查看节点是否连接上
如上图所示,就是成功连接了.
推送数据到 Pushgateway 强烈建议查看官方 GitHub 文档 来实现数据推送,以下内容可能随版本更新而失效.
Fields Desc pushgateway Pushgateway地址port Pushgateway端口job_name 作业名称 metric 测量值名称 metric_value 测量值
1 echo "[metric] [metric_value]" | curl --data-binary @- http://[pushgateway]:[port]/metrics/job/[job_name]
1 echo 'metric{FIELD="VALUE",FIELD2="VALUE2",FIELD3="VALUE3"}' | curl --data-binary @- http://[pushgateway]:[port]/metrics/job/[job_name]
1 2 3 4 5 6 7 8 9 cat <<EOF | curl --data-binary @- http://[pushgateway]:[port]/metrics/job/[job_name] metric{label="val1" } 42 metric2 2398.283 EOF
具体 TYPE 类型请查看官方文档.
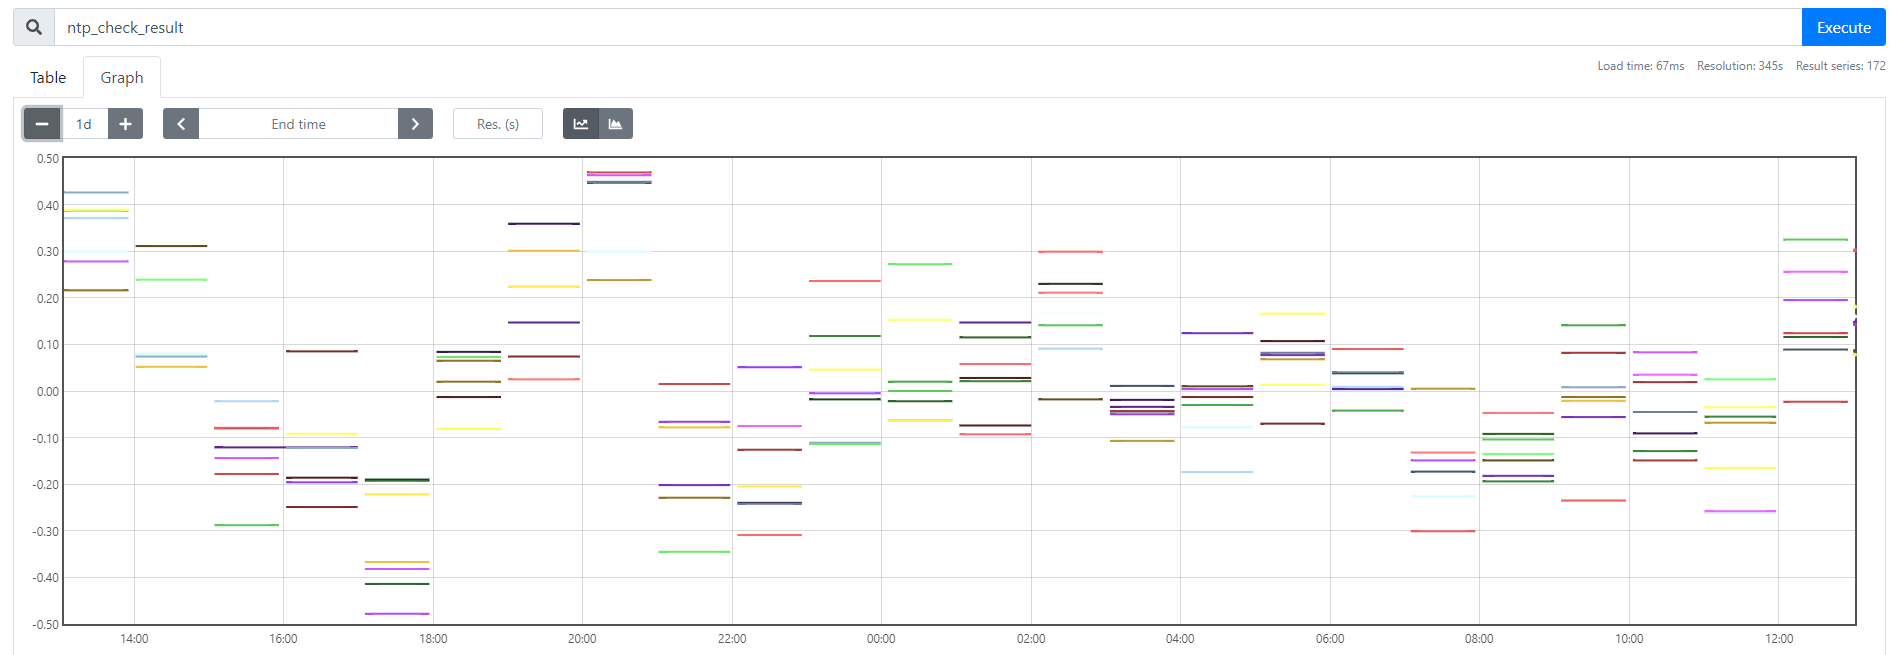
在 Prometheus 中查询数据 在搜索框中输入你要查询的metric,并选择适当的时间段
示例数据
1 ntp_check_result{biz="2" , env="test" , exported_instance="host-ip" , exported_job="ntp_check" , instance="localhost:9091" , ip="ip" , job="prometheus-pushgateway" , ntp_server="ip" , offset="-0.022" , time="2020-05-18" }
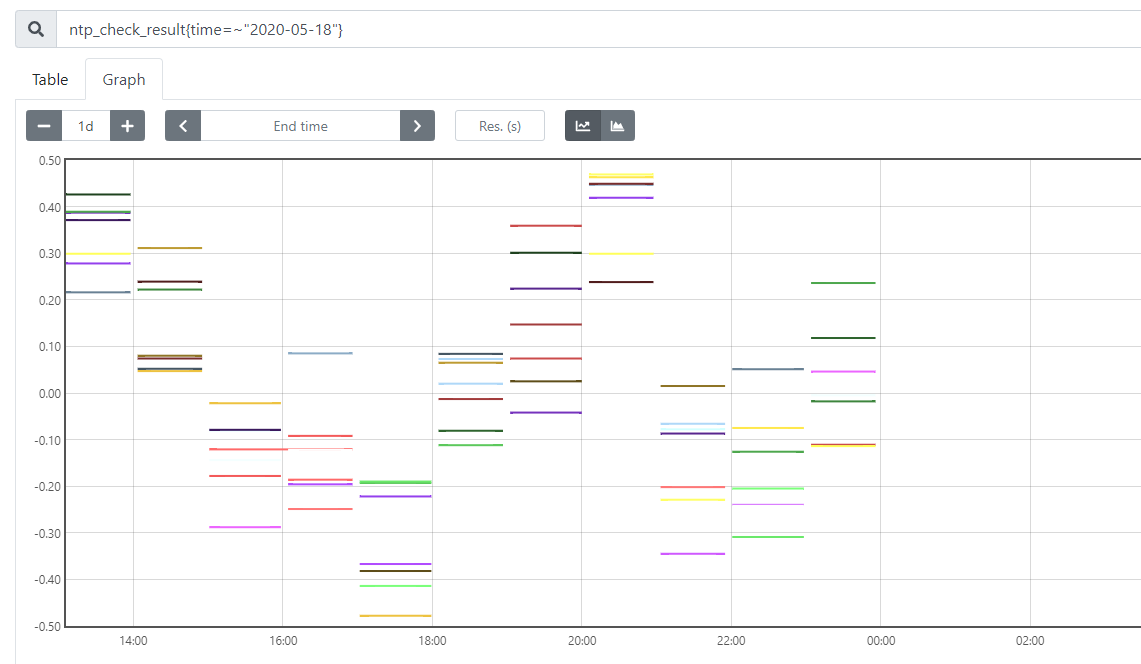
你也可以根据上报的字段值来搜索特定的数据
在 Prometheus 中查询数据 - API 详情请查看 prometheus-doc-api ,以下脚本供参考(python 2.7.5 环境)
1 2 3 4 5 6 7 8 9 10 11 12 13 14 15 16 17 18 19 20 21 22 23 24 25 26 27 28 29 30 31 32 33 34 35 36 37 38 39 40 41 42 43 44 45 46 47 48 49 50 51 52 53 54 55 56 57 58 59 60 61 62 63 64 65 66 67 68 69 70 71 72 73 74 75 76 77 78 79 80 81 82 83 84 85 86 87 88 89 90 91 92 93 94 95 96 97 98 99 100 101 102 103 104 105 106 107 108 109 110 import urllibimport urllib2import jsonimport timeimport argparse__host_prometheus = 'host:ip' __url = "http://{host}/api/v1/query" .format(host=__host_prometheus) __url_2 = "http://{host}/api/v1/query_range" .format(host=__host_prometheus) __fmt_query = 'ntp_check_result{{time=~"{date}"}}' __headers = { 'Content-Type' : 'application/x-www-form-urlencoded' } class HostData : def __init__ (self) : pass @classmethod def from_json (cls, json_data) : _instance = cls() _instance.ip = json_data['ip' ] _instance.server = json_data['ntp_server' ] _instance.offset = json_data['offset' ] _instance.time = json_data['time' ] return _instance def __str__ (self) : return str(self.__dict__) def get_json (self) : return json.dumps(self.__dict__) def get_data (query_date) : timestamp_in_sec = time.mktime(time.strptime(query_date, '%Y-%m-%d' )) + 3600 print 'query_date:' , query_date, ',query_time_in_sec:' , timestamp_in_sec post_data = urllib.urlencode({ 'query' : __fmt_query.format(date=query_date), 'time' : timestamp_in_sec }) req = urllib2.Request( __url, data=post_data, headers=__headers ) resp = urllib2.urlopen(req) res = json.loads(resp.read()) return res def get_data_in_range (query_date, date_start, date_end, step_in_sec=3600 ) : print 'query:date=' , query_date, 'date_start=' , date_start, 'date_end=' , date_end timestamp_start_in_sec = time.mktime(time.strptime(date_start, '%Y-%m-%d' )) timestamp_end_in_sec = time.mktime(time.strptime(date_end, '%Y-%m-%d' )) post_data = urllib.urlencode({ 'query' : __fmt_query.format(date=query_date), 'start' : timestamp_start_in_sec, 'end' : timestamp_end_in_sec, 'step' : step_in_sec }) req = urllib2.Request( __url_2, data=post_data, headers=__headers ) resp = urllib2.urlopen(req) res = json.loads(resp.read()) return res def combine_data (res) : hosts = [] if res['status' ] == 'success' : for metric_data in res['data' ]['result' ]: host = metric_data['metric' ] hosts.append(HostData.from_json(host)) pass for host in hosts: print host.get_json() parser = argparse.ArgumentParser(description='get server NTP config from Prometheus.' ) parser.add_argument('--date' , '-d' , help='date:yyyy-mm-dd' , required=True ) args = parser.parse_args() if __name__ == '__main__' : if 'date' in args.__dict__: try : time.strptime(args.__getattribute__('date' ), '%Y-%m-%d' ) except ValueError as e: print 'error:' , e exit(1 ) combine_data(get_data(args.__getattribute__('date' )))
Prometheus 查询 Pushgateway 的 job 和 instance 名称问题在默认配置中, Pushgateway 会将上报的 job 和 instance 数据带到 exported_job 和 exported_instance 中,如要修改此行为,修改 prometheus.yml 中 Pushgateway 的配置:
1
2
3
4
5
6
- job_name: 'prometheus-pushgateway' honor_labels: true static_configs: - targets: ['localhost:9091' ]
修改完毕后重启即可生效.